Virtual Instrument (VI) is a new achievement that is increasingly developed in the process of intensive penetration of computer hardware, software and bus technology into other related technologies. . Since the specialized functions of the instrument and the panel controls are formed by software, such new instruments are called "virtual instruments" internationally. It uses the data processing and graphics processing functions of the microcomputer to softwareize the specialized functions and panel controls of the traditional physical instruments, and the interface between the detected data is also realized by computer software. From the virtual instrument display panel (such as virtual display, digital display and indicator light and oscilloscope, which corresponds to various physical instruments in function), you can understand the state of the instrument and read the test results for analysis.
This article refers to the address: http://
1 Vehicle load cell overview
According to the characteristics of the virtual instrument, the vehicle load detecting device of the capacitive load cell is used as the elastic body of the load cell in the vehicle buffer damping mechanism, and the static or dynamic detection can be performed anytime and anywhere. Under the action of the load, the buffer damping mechanism (plate spring) of the automobile is deformed, and the distance between the two plates of the capacitive sensor installed at a specific position changes, the capacitance value changes, and the output voltage of the sensor also changes. Based on the parameter analysis of the static performance of the virtual instrument, the law of the voltage change between the two pole plates of the capacitive sensing 货物 when the vehicle changes at rest is analyzed, which is used as a reference for testing the dynamic performance. It is convenient and intuitive to analyze the voltage value corresponding to a specific load and use the virtual instrument program subVI to perform error analysis and curve fitting. The installation of the capacitive load cell is shown in Figure 1.
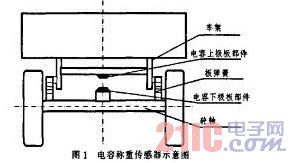
The upper plate part of the capacitor is mounted on the lower part of the frame, centered on the left and right; the lower plate part of the capacitor is mounted above the middle of the axle, and is aligned with the upper plate of the capacitor. A set of capacitive sensors is mounted above each axle of the vehicle.
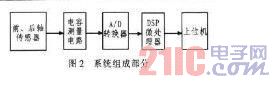
The relationship between the elements of the vehicle weighing system is as follows:
Under the action of the load, the shock absorbing mechanism (steel spring) of the automobile is deformed, and the distance d between the two plates of the capacitive sensor changes, and the capacitance value of the sensor also changes. The relationship between the output voltage value of the sensor circuit and the load value of the axle is pre-calibrated, and the load quality of the axle can be obtained according to the voltage value of each axle sensor circuit. By adding the load masses of the respective axles, the overall vehicle load quality can be obtained.
2 Test and data analysis
The static analysis test for detecting vehicle load based on the virtual instrument-based capacitance method was performed on the Panther SM1010. The vehicle is a two-axis leaf spring construction with a rated load of 500 kg. During the static experiment, the vehicle was kept in a horizontal state, and the two wheels were vertically pressed on the SCS-2蛩 electronic digital platform scale. The vehicle is loaded or unloaded with a 100 kg weight as a standard unit load. The test is divided into two strokes (each stroke includes both positive and negative directions), which are loaded or unloaded in the following order:
Forward 1 - in the free state of the vehicle (no hysteresis), gradually load from no-load until the sensor output reaches full scale;
Reverse 1 - gradually unloaded to no load on the basis of positive 1;
Forward 2 - on the basis of reverse 1 (with hysteresis), gradually load from no load until the output reaches full scale again;
Reverse 2 - On the basis of the positive 2, gradually unload to no load.
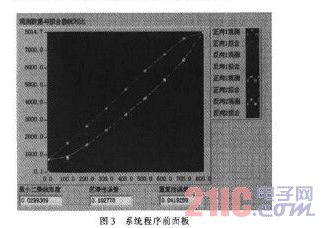
According to the test data, the arithmetic mean of the two forward and reverse sensor outputs is obtained separately and the arithmetic mean of the total process is obtained. It is programmed by the virtual instrument programming software LabVIEW platform. The front panel of the block diagram is as follows.
The software programming adopts modular design, which mainly includes curve fitting module, straight line fitting and error analysis module. The least square linearity, hysteresis error and repeatability error in the error analysis module are in the form of subVIs, which provides great convenience for the analysis and programming of dynamic parameters. The error processing module mainly analyzes and processes the data repeatability error, maximum standard deviation and hysteresis error in the process of analyzing data. These data are used as a basis for subsequent data processing and capacitive load cell compensation system programming, such as repetitive error programming as shown in Figure 4. In order to grasp the influence of acceleration on the load detection of the capacitive method vehicle, according to the corresponding relationship between the pre-calibrated load mass and the output voltage of the capacitive sensor, the load quality of the front and rear axles and the whole vehicle under a certain acceleration (aH) is obtained. The results are shown in Table 1.
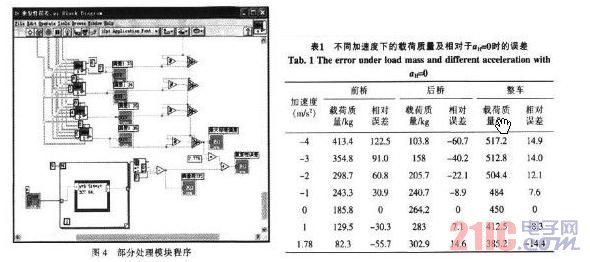
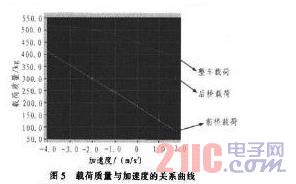
From the table, it can be seen that during the braking process, the acceleration of the aH=4 m/s2 compared with the aH=0, the front axle load mass detected by the capacitive sensor is increased by 122.5%, and the rear axle is reduced by 60. .7%, the vehicle load mass increased by 14.9%; during acceleration, the acceleration aH=1.78 m/s2 compared with aH=0, the front axle load mass decreased by 55.7%, and the rear axle increased. It was 14.6% larger and the vehicle load quality was reduced by 14.4%. It can be seen that the acceleration has a great influence on the vehicle load detection. In order to ensure the accuracy of the detection result, software compensation must be used.
The relationship between the load mass and the acceleration plotted according to the data in Table 1 is shown in Fig. 5.
The results of the above analysis system show that the capacitive vehicle weighing device has good repeatability when it is static, but it also has certain nonlinear error and large hysteresis, which directly affects the load detection result. The main cause of nonlinear errors is the relationship between the relative change in capacitance and the nonlinearity between the plates. There are two main reasons for the hysteresis (including the reverse stroke not returning to zero): 1) the real material has hysteresis to some extent; 2) the height and length of the leaf spring vary with the load when the vehicle load is different. Changes, friction between the spring pieces, friction between the two ends of the spring piece and the frame. The use of leaf springs with highly elastic materials, improved mechanical design, and reduced friction can reduce the effects of hysteresis. The use of software for nonlinear compensation and hysteresis compensation is very obvious.
3 Conclusion
The virtual instrument-based vehicle weighing analysis system has the characteristics of convenient operation, friendly user interface and easy programming. Although the virtual instrument does not have a real instrument panel, it is far superior in function to traditional physical instruments. It has been proved that the vehicle weighing system based on virtual instrument is not only suitable for the static measurement analysis of vehicle load by capacitance method, but also suitable for dynamic measurement analysis with larger data volume. The innovation of this paper is to use the software panel of the virtual instrument to analyze the static measurement of the vehicle load by the capacitance method, which not only gets rid of the shortcomings of the list statistics, but also the results are convenient and fast.
Shenzhen Isource lighting Co., Ltd , https://www.isourceled.com